
Hardware sensors
Temperature, RH, CO₂, PM₂.₅
Building application · IES Live
A building- and room-level digital representation of indoor air quality that brings real-time and historical information into one decision-support interface.
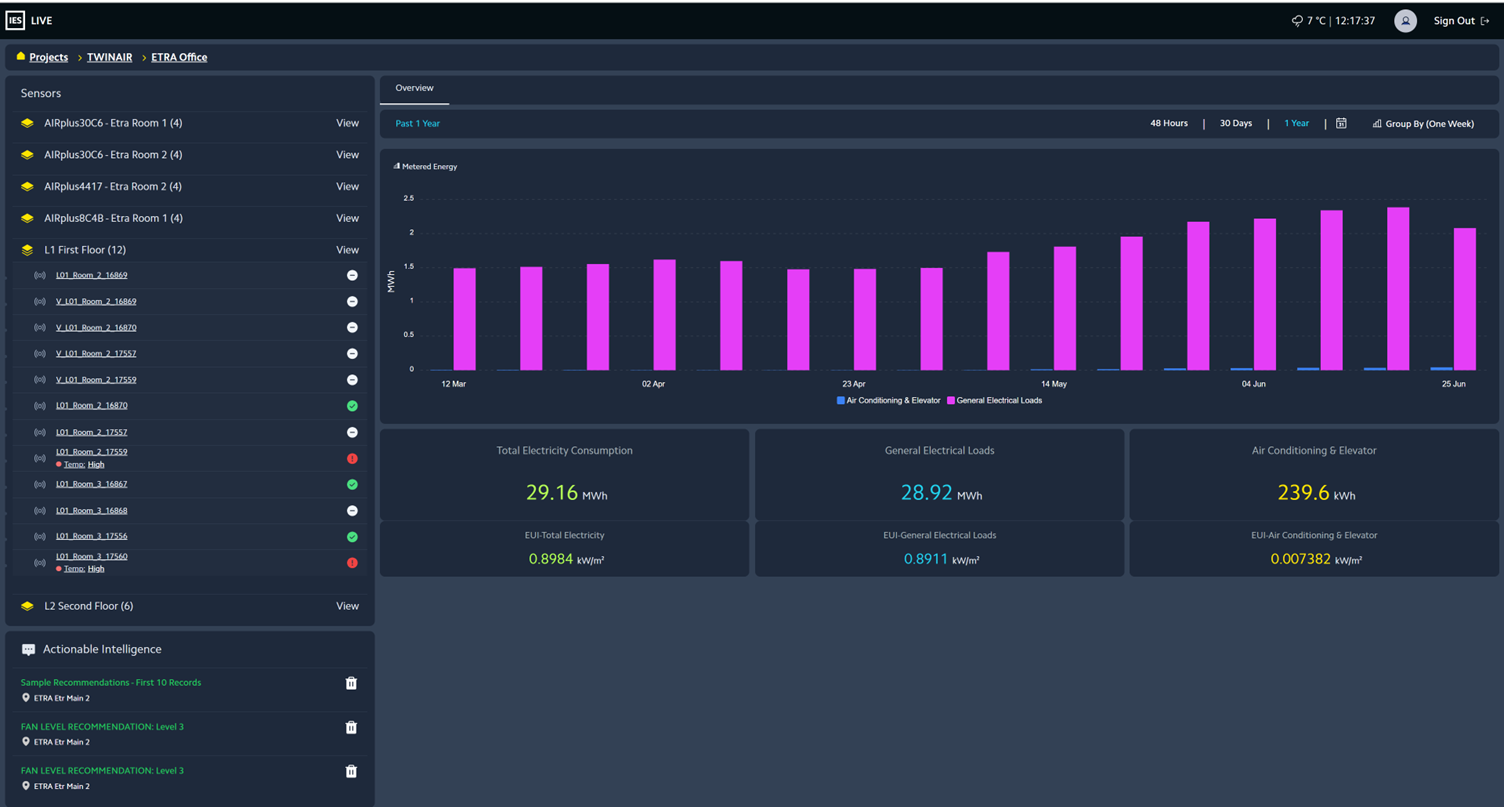
Role in TwinAIR
The Building Digital Twin acts as the integration and visualisation layer for building-level IAQ. Upstream data is consolidated in the TwinAIR DMP, processed for analysis, and presented through IES Live as information that can be understood in the context of a building, floor or room.
Temperature, RH, CO₂, PM₂.₅
Predicted or inferred IAQ observations
Filter status, fan levels and operational data
Prediction outputs and IAQ reference thresholds
TwinAIR
Validated real-time and historical observations
Structures and processes data for analysis and visualisation.
Building, floor and room-level interpretation.
Building & room context
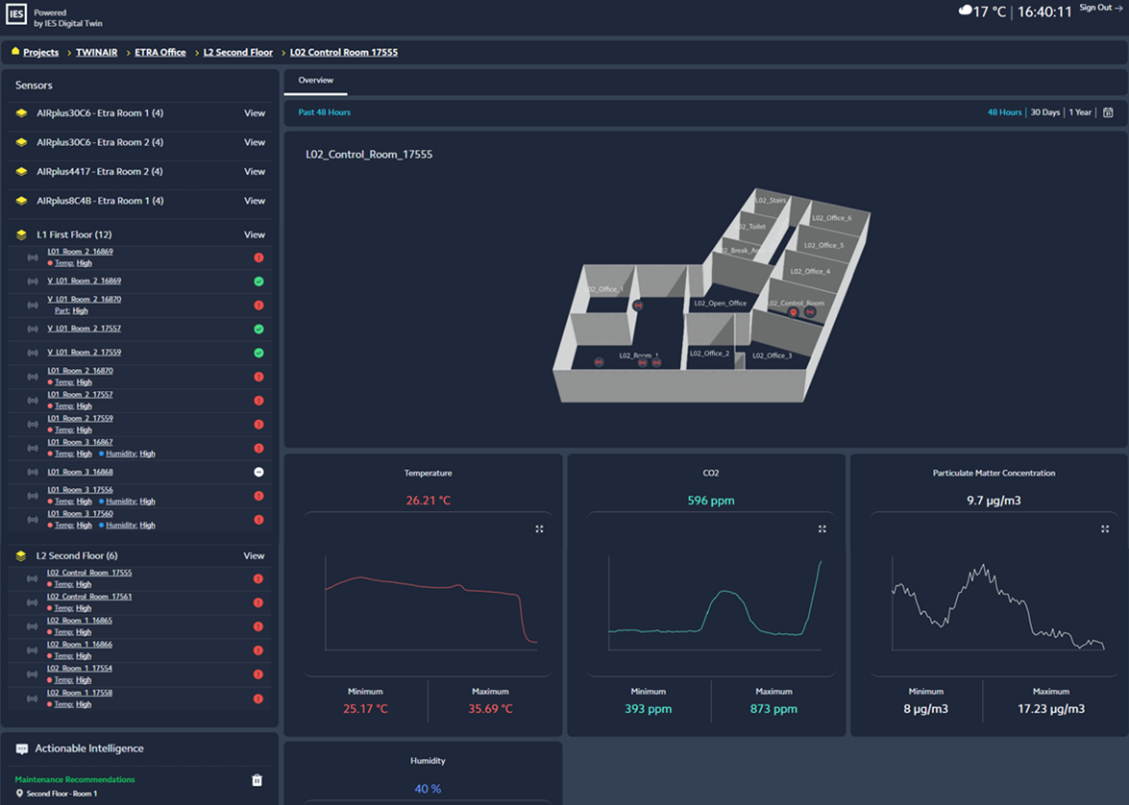
Example of IAQ data structured and visualised at building and room level.
Temperature
Current + historical trend
Relative humidity
Current + historical trend
CO₂
Current + historical trend
PM₂.₅
Current + historical trend
Maps IAQ observations to buildings, floors and rooms so users can understand exactly where conditions occur.
Highlights conditions against agreed IAQ thresholds using clear status indicators rather than raw measurements alone.
Combines current and historical time-series information so changes in indoor conditions can be interpreted over time.
Brings monitoring, forecasting and available recommendations into a consistent user-facing interface.
Inputs & outputs
The BDT does not replace the DMP. It consumes integrated information and turns it into a spatial, interpretable view for people who need to understand indoor conditions rather than inspect raw platform data.
Key inputs
Key outputs
Integration example · ETRA Room 2
UCAM reinforcement-learning recommendations are retrieved through the DMP, processed and published in IES Live to support interpretation of filtration control actions.
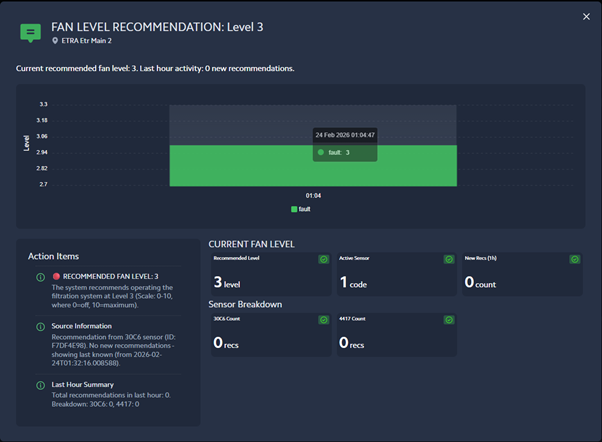
Example recommendation
Fan level 3
Dashboard content
Trend + KPI summary
Refresh workflow
Hourly
Designed for interpretation
The interface is intended to make IAQ conditions accessible to users with different technical backgrounds, from occupants to researchers and building operations teams.
Awareness-oriented access to indoor conditions
Room-level monitoring and informed decision-making
Operational context, alerts and recommendations
Trend analysis, validation and pilot evaluation
TwinAIR ecosystem
Follow an observation from sensing and DMP processing through to building-level interpretation and downstream insight.